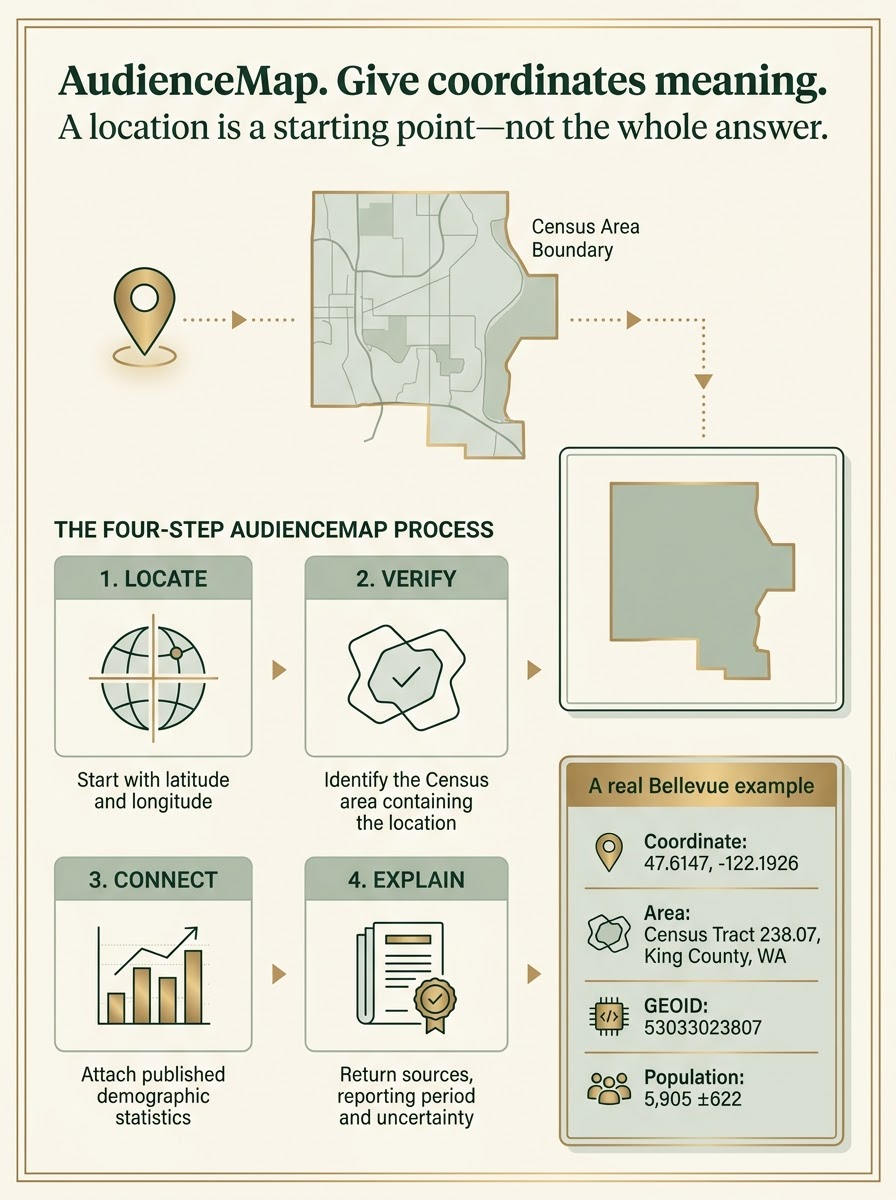
AudienceMap gives AI applications source-backed geographic context. Starting with a coordinate, it identifies a supported Census area and connects it to published demographic statistics—with sources, reporting periods and uncertainty preserved.
A managed-service product by AITrailblazer. We maintain the geographic evidence pipeline so your team can focus on its application.
Explore three saved coordinate results in King County and six ACS measures for the primary Bellevue tract. Try a structured-answer check in your browser. Public API access is not yet open.
Actual Census tract outline · ACS 2024 geometry · decorative grid
3Saved examples including outside coverage
6ACS measures with published uncertainty
90%Confidence level for published margins of error
The evidence, not just the promise
Real geography. A traceable answer.
Choose a saved point to see its matched tract and available American Community Survey (ACS) statistics—or an explicit coverage limit. A tract is a small statistical area, not necessarily a named neighborhood. This is a saved-evidence demonstration, not a live lookup.
Saved Bellevue result: 47.6147, −122.1926 → tract 53033023807. The matched boundary contains the original coordinate. A second location resolves to tract 53033023901; a point outside coverage returns no match. Enable JavaScript to switch examples; the profile and JSON download remain available without it.
One saved Bellevue population fixture. Four authored answer variants. Change the answer and see which of five field checks fails—entirely in your browser.
With JavaScript disabled: the correct fixture passes all five checks; a wrong GEOID fails tract identity, a missing MOE fails uncertainty, and assigning tract median income to a household fails scope.
This checks specified JSON fields against a saved fixture. It does not grade free-form prose, run a model, rerun containment, or validate an arbitrary coordinate. Passing all five checks is not a guarantee that every possible claim is correct.
For AI labs and systems integrators evaluating geographic answers, and teams maintaining location-based evidence. These are intended uses—not existing customer deployments.
01
Agent evaluation & synthetic environments
Use versioned reference cases to test whether an agent selects supported geography, preserves uncertainty and declines unsupported claims. Keep synthetic scenarios separate from observed Census evidence.
A bounded evidence reference—not a complete model benchmark or rooftop-recognition platform.
02
Location analytics with an evidence trail
Connect supplied coordinates to official Census context for area profiles, research and reporting. Retain source periods and missing-data states rather than substitute a nearby place or unsupported estimate.
Area context—not property valuation, household profiling, eligibility, hazard assessment or navigation.
Insurance, energy and logistics applications are later possibilities requiring additional datasets, coverage and domain-specific validation. They are not demonstrated by this sample.
AudienceMap is being built as a managed service on Google Cloud (GCP), with REST API access for applications and a Model Context Protocol (MCP) tool for AI agents. The interface is designed to return the supported area's identifier, selected statistics and evidence metadata—not a large polygon file to interpret.
Interface preview—not a live endpoint or a finalized API contract. The responses below project saved evidence into a readable structure; they are not captured HTTP responses.
MCP interface preview: resolve_spatial_context Authentication, coverage and service limits will be defined before access opens.
Coordinates use WGS84. GEOIDs remain strings. A missing profile is distinct from no geographic match. Every available metric preserves units and its 90% MOE. Authentication, version negotiation, exact-border policy and HTTP error semantics will be agreed before API access opens.
Full source references and all six primary-tract measures: public sample JSON. Hosted latency and throughput have not yet been benchmarked.
Pilot planning · not an existing customer integration
Start with one real agent task.
Where is geographic context difficult to retrieve or evaluate in your workflow? Start with one representative task, then agree on a small pilot rather than assume a fit.
01
Define the task
Specify the input coordinates, supported geography, requested statistics and source periods. Agree on the response structure and how the application or agent will consume it.
02
Agree on correctness
Pin reference data and expected results. Include near-boundary points, outside-coverage queries, unavailable statistics and unsupported periods. Define exact-border behavior before scoring those cases.
03
Measure the hosted service
Validate API and MCP behavior, access controls and input/log handling. Measure end-to-end latency, response size and throughput under an agreed workload; compare results with acceptance criteria set before testing.
The starting scope
The current demonstration covers King County Census tracts and six ACS measures for the primary Bellevue example. Municipal boundaries, flood zones, zoning, building heights and property profiles are not included. Public API access is not yet open.
Public sources, explicit responsibilities
The sample uses public U.S. Census boundaries and aggregate ACS statistics with traceable sources. Customer inputs, logs, additional datasets and downstream uses still need appropriate privacy, rights and access controls.
Start with a latitude and longitude and check the available coverage.
02 /
Verify
Identify the Census area whose boundary contains the location.
03 /
Connect
Attach published statistics using the area's official identifier (GEOID).
04 /
Explain
Return the result with its sources, reporting periods and uncertainty—or an explicit no-match.
What has been checked
The primary Bellevue tract agrees with an independent Census Geocoder lookup. Boundary matches remain relative to the retrieved Census geometry—not a survey-grade determination.
Saved source responses and integrity hashes support repeatable checks. The recorded offline replay reproduced the sample identically. Hashes detect changed bytes; they do not prove that a source is error-free.
What the statistics mean
A Census tract is a statistical area, not necessarily a named neighborhood. Five-year ACS estimates describe a survey period—not a current snapshot of residents. This sample contains no property profiles or individual household records.
These figures describe the tract as a whole. They do not establish the income, characteristics or circumstances of any person or household at this coordinate.
Schematic illustration—not an authoritative Census boundary map. Bellevue population: 2020–2024 ACS 5-year estimate; ±622 is the published 90% margin of error. Statistics describe the tract, not a person or property. Saved local example; managed API and MCP access are in development.
Share your feedback on the preview, what you’re building and what you would like to evaluate. Constantine will review your message and reply by email with a sample link.
The ZIP includes a readable brief, three saved coordinate examples, six ACS measures for the primary Bellevue tract, five evaluation cases, an offline verifier, preserved Census source responses and a file-integrity manifest.
The full ZIP is shared by an unlisted link, not published on this page. Requests are reviewed personally; submitting the form does not automatically unlock a download. The preview above remains available to everyone.
Contact Constantine
Tell me about your workflow.
To request the full sample, share your feedback on the preview and describe your use case in the message below. I’ll reply personally with the sample link. General questions and pilot enquiries are welcome too.